
Has US high yield been impacted by recent market volatility?
- 01 April 2025 (7 min read)
KEY POINTS
It’s fair to say that we have seen a significant shift in market dynamics related to the US macro-outlook, instigated by tariff and general policy uncertainty which is affecting both business and consumer confidence. As a result of downwards revisions to growth, the market is now pricing that the Federal Reserve (Fed) will need to cut rates three times before year-end.
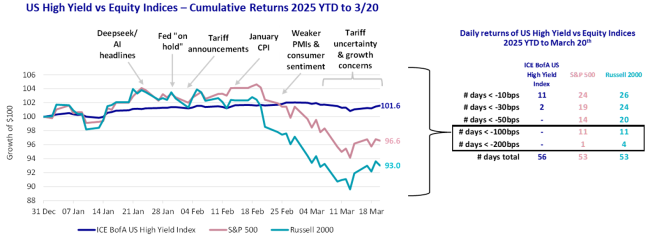
US equity markets have reflected these concerns with heightened day-to-day volatility as the headlines have evolved, as the chart below demonstrates. As of 20 March 2025, the S&P 500 is down 3.4% and the Russell 2000 down 7.0%. Meanwhile, the US Hield Yield market has been resilient so far, posting a +1.6% YTD return1 . The right-hand side of the chart shows how many negative days < -10bps that each of these indices has experienced YTD (along with subsequent tiers). The S&P 500 and Russell 2000 have experienced 24 and 26 days, respectively, that have been below -10bps out of 53 days on which they have priced YTD (45% and 49% of total daily returns)2 . The US HY market, on the other hand, has experienced just 11 days in total that have been less than -10bps (20% of total daily returns). The US HY market has experienced two days with returns less than -30bps, but zero days lower than -50bps3 . Both the S&P 500 and Russell 2000, however, have experienced 11 days lower than -100bps and a handful of days lower than -200bps2.
Past performance is not a guide to future performance.
- U291cmNlOiBJQ0UgQm9mQSBVUyBIaWdoIFlpZWxkIEluZGV4IGFzIG9mIDIwIE1hcmNoIDIwMjU=
- U291cmNlOiBTJmFtcDtQIDUwMCBJbmRleCwgUnVzc2VsbCAyMDAwIEluZGV4LCBhcyBvZiAyMCBNYXJjaCAyMCAyMDI1LiBUaGVyZSBpcyBubyBndWFyYW50ZWUgdGhhdCB0aGUgbWFya2V0IHdpbGwgZXhwZXJpZW5jZSB0aGUgc2FtZSBtb21lbnR1bSBhcyBpbiB0aGUgcGFzdCBmZXcgeWVhcnMuIEl0IGlzIG5vdCBwb3NzaWJsZSB0byBpbnZlc3QgZGlyZWN0bHkgaW4gYW4gdW5tYW5hZ2VkIGluZGV4Lg==
- U291cmNlOiBJQ0UgQm9mQSBVUyBIaWdoIFlpZWxkIEluZGV4IGFzIG9mIE1hcmNoIDIwLCAyMDI1LiBQYXN0IHBlcmZvcm1hbmNlIGlzIG5vdCBhIGd1aWRlIHRvIGZ1dHVyZSBwZXJmb3JtYW5jZS4gVGhlcmUgaXMgbm8gZ3VhcmFudGVlIHRoYXQgdGhlIG1hcmtldCB3aWxsIGV4cGVyaWVuY2UgdGhlIHNhbWUgbW9tZW50dW0gYXMgaW4gdGhlIHBhc3QgZmV3IHllYXJzLiBJdCBpcyBub3QgcG9zc2libGUgdG8gaW52ZXN0IGRpcmVjdGx5IGluIGFuIHVubWFuYWdlZCBpbmRleC4=
In AXA IM’s US High Yield team, we have been saying for some time that, despite having a relatively high correlation to equity markets over the medium- to long-term, unlike equity markets, the US HY market did not necessarily need GDP growth to remain at the pace it had been over the past couple of years to support current valuations. For the HY asset class, a low, positive GDP environment can potentially offer a constructive environment in which HY companies should still have enough room to operate and grow revenues. This compares favourably to a much hotter economy, which can have a negative impact on the higher quality, more rate sensitive securities within HY, as well as lead to excessive corporate exuberance. Of course, a low, positive GDP environment also compares favourably to a recessionary environment which can lead to balance sheet deterioration and a pick-up in defaults.
At the March FOMC meeting, the Fed revised its GDP expectations for 2025 down by 0.4% to 1.7%, but still expects around 1.8% over the longer run. This 0-2% range should be fine for HY and this divergence with the equity outlook has been reflected in the comparable volatility that the two markets have experienced given recent headlines.
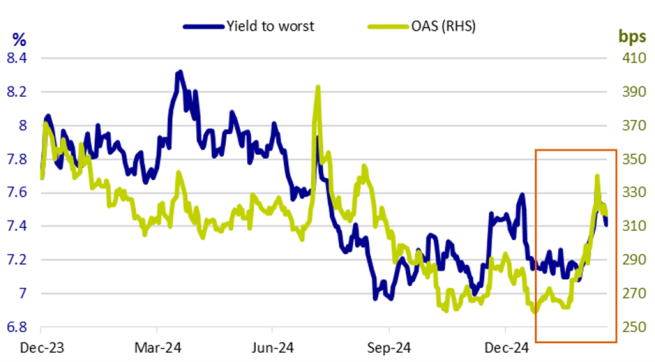
After initially tightening in January to a low of 259basis points (‘bps’), spreads have risen by 58bps from that low to 317bps as of 20 March 2025. As the chart below shows, this reflects a modest widening from historically tight levels but only gets us back to where we were in September. Again, our view coming into the year was that spreads would likely come under pressure at points throughout 2025 given the extent of the compression that we have witnessed, but that ultimately would still reflect both the recent strong fundamental and technical backdrop, as well as longer-term structural changes in the market (better liquidity, record low duration, improved credit quality, higher % of secured).
A counterargument could be that the equity market would naturally react first to a deterioration in the outlook, but that potential contagion may lie ahead for credit spreads. We acknowledge these concerns and see some validity in some recent sell-side reports revising spread forecasts modestly wider in the near term given the heightened level of uncertainty and continued volatility in the Treasury market. Nevertheless, we remain of the view that spreads will stay well supported after any sell-off due to the amount of cash on the sidelines and investors who have been waiting for better entry points.
Importantly, we have not seen anything yet in the past few weeks to change our view on defaults, which is ultimately what spreads are compensating investors for. The HY bond par-weighted 12-month trailing default rate as of February 2025 was 0.3% (excl. distressed exchanges) and 1.3% (incl. distressed exchanges)4 . This compares to a 25-year average (incl. distressed exchanges) of 3.4%. With the exception of the expected distressed exchange transaction to be completed by Altice France (SFRFP) later this year, which should add around 50-60bps to the ‘incl. distressed exchange’ default rate when it goes through, we do not see any other large candidates for default that have the potential to move the needle right now. It is worth noting that the SFRFP exchange is already priced by the market and so the impact on overall market valuations should be minimal. In summary, a default rate in the region of 1-3% (incl. distressed exchanges) for 2025 still seems the most likely scenario to us, which remains in-line or below long-term historical averages. Technicals have also started the year on a strong footing, with resilient demand, deals over-subscribed, and a lack of M&A related new supply that had been anticipated, being potentially pushed out for now due to the tariff uncertainty.
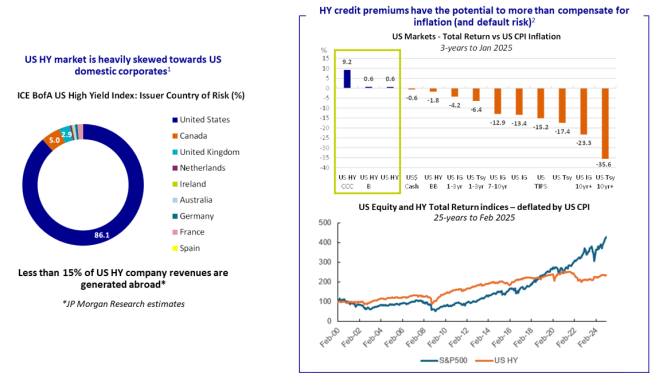
We have also seen inflation expectations being revised up, given the potential for weaker migration that is likely to keep the labour market tight and the introduction of wide-ranging tariffs, which should put pressure on international supply chains and lead to higher domestic prices. On tariffs, we consider the US HY market to be quite well insulated from escalating trade wars, given its domestic focus. As the chart on the left below shows, US domestic corporates make up 85-90% of the broad US HY index and some sell-side reports estimate that less than 15% of US HY company revenues are generated abroad. This compares to investment grade which has a greater proportion of multi nationals and 27% of non-US companies.
That said, indirect impacts could come through supply chain disruption and a decline in business and consumer confidence, particularly given the potential inflationary feed through from tariffs. HY sectors most at risk from escalating trade wars include Autos, Retail and Consumer Products. For now, guidance from companies as to H1 earnings has been coming down on the whole, with many companies in ‘wait and see’ mode for H2 if more clarity emerges, which may allow them to make decisions around the size of their workforce, the amount of capex they are willing to commit and investments they are able to make.
It is worth emphasising that, historically, the HY market has been a relatively inflation-proof asset class over the long term. The charts on the right below show that the US HY market has been one of the few fixed income asset classes to have generated a positive total return after being adjusted for CPI inflation in the three-year period to January 2025, which has seen the highest inflation prints in a generation. At the bottom, the chart shows the US HY market and S&P 500 index deflated by CPI inflation over a 25-year period, where until 2019 the US HY market was even outperforming the S&P 500 after adjusting for inflation. This is because HY has a shorter average maturity and a lower duration than other fixed income asset classes, meaning it will generally be less negatively impacted by a tightening in monetary conditions (i.e., higher rates) instigated by central banks to combat inflation than higher quality fixed income, offering the potential for the HY credit premium embedded in the spread to generate positive real returns over the medium term.
Past performance is not a guide to future performance.
- U291cmNlOiBKUE1vcmdhbiBkZWZhdWx0IHJhdGUgYXMgb2YgRmVicnVhcnkgMjAyNQ==
(1) ICE BofA, as of 28 February 2025. (2) As of 27 February 2025. * Estimation made by JP Morgan Research in US Credit Impacts of Trump’s Economic Proposals, as of 30 July 2024. It is not possible to invest directly in an unmanaged index.
Where to look across US high yield?
In this environment of uncertainty, it may be worth investors considering a short duration approach. Short duration bonds by their nature offer investors a more defensive investment at times of market stress. US short duration high yield also makes up about a third of the overall US HY market and, as such, offer investors a liquid asset class in the largest and most established high yield market.
While we expect rates to be cut, right now, despite recent US Treasury curve steepening, the HY yield curve is still relatively flat. This means that for more defensively minded strategies there are still opportunities in the current market. Alongside this, if the market does not perform as well as expected or is too aggressive in its expectations for rate cuts, then a defensive short duration approach should be able to protect on the downside. If the market performs better than expected like the last couple of years, then such approaches should still be able to capture 75-80% of the HY market return.
Another consideration is that while spreads are on the tighter side of historical averages, yields remain attractive. It is this yield that will drive the return for short duration. Spreads are likely to be relatively range bound during the year, but will experience volatility and could very well finish the year slightly wider. This, however, is unlikely to have a material impact on shorter duration securities.
So, in summary, we believe short duration strategies, especially actively managed ones that take a conservative, up-in-quality approach, should offer a nice balance of potential outcomes in a wide range of economic scenarios and should protect investors against both interest rate volatility and spread volatility.


Disclaimer
This document is for informational purposes only and does not constitute investment research or financial analysis relating to transactions in financial instruments as per MIF Directive (2014/65/EU), nor does it constitute on the part of AXA Investment Managers or its affiliated companies an offer to buy or sell any investments, products or services, and should not be considered as solicitation or investment, legal or tax advice, a recommendation for an investment strategy or a personalized recommendation to buy or sell securities.
Due to its simplification, this document is partial and opinions, estimates and forecasts herein are subjective and subject to change without notice. There is no guarantee forecasts made will come to pass. Data, figures, declarations, analysis, predictions and other information in this document is provided based on our state of knowledge at the time of creation of this document. Whilst every care is taken, no representation or warranty (including liability towards third parties), express or implied, is made as to the accuracy, reliability or completeness of the information contained herein. Reliance upon information in this material is at the sole discretion of the recipient. This material does not contain sufficient information to support an investment decision.
Issued in the UK by AXA Investment Managers UK Limited, which is authorised and regulated by the Financial Conduct Authority in the UK. Registered in England and Wales, No: 01431068. Registered Office: 22 Bishopsgate, London, EC2N 4BQ.
In other jurisdictions, this document is issued by AXA Investment Managers SA’s affiliates in those countries.
© 2025 AXA Investment Managers. All rights reserved